Solid, behind the scene
The setting
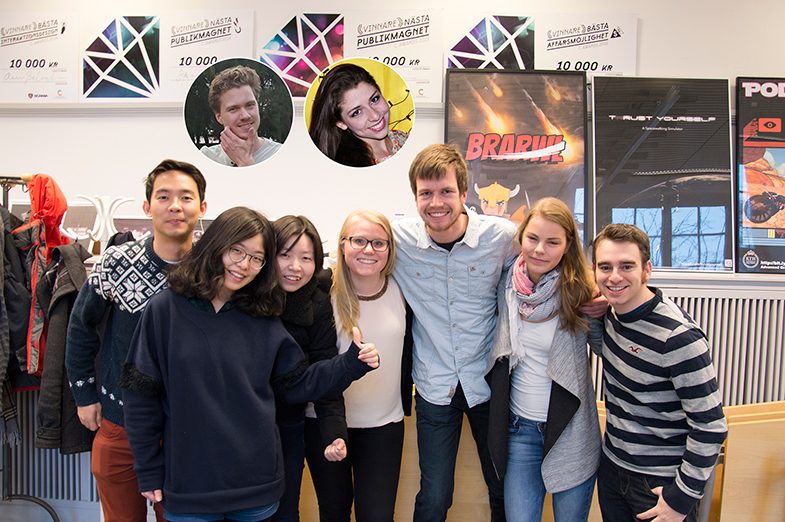
It all started from the brief of the final project of the Information Visualisation course (IVIS16). We were 9 people in total. I was the second last person who joined the team. In the team, there were programmers, designers, and business students. The brief was pretty broad and generous. Basically, we could do whatever we wanted in the area of visualising data in the proper scale for a big team. There would be several deadlines for this big project which were the proposal idea presentation, the “hello world” presentation, the final demo presentation, and the C-Awards submission.
The proposal
We had several meetings discussing about “everything”. The first proper meeting was more about introducing ourselves since we didn’t know much about each other. Not the whole group was there. Some people or someone were missing. We talked about our background, who we were, what we can do, and what we would like to do in this project. We brainstormed a little bit just to kick-start and find some directions. However, we didn’t talk about the team dynamic and group working stuff. We didn’t have a team leader. Well, it was way too soon to have since we hadn’t had a clear topic for our project.
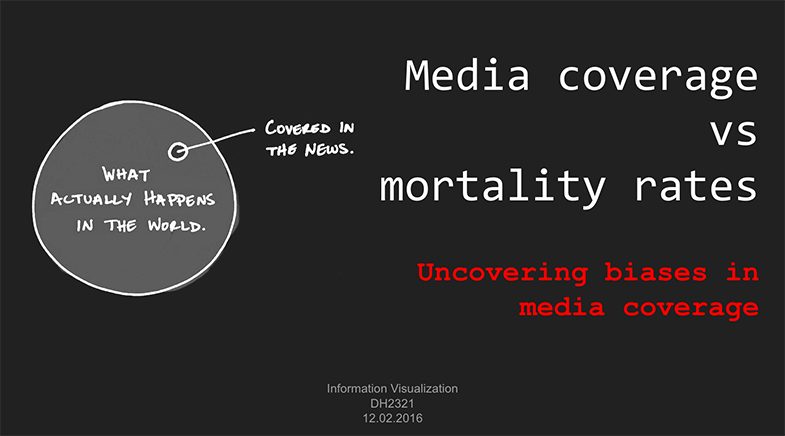
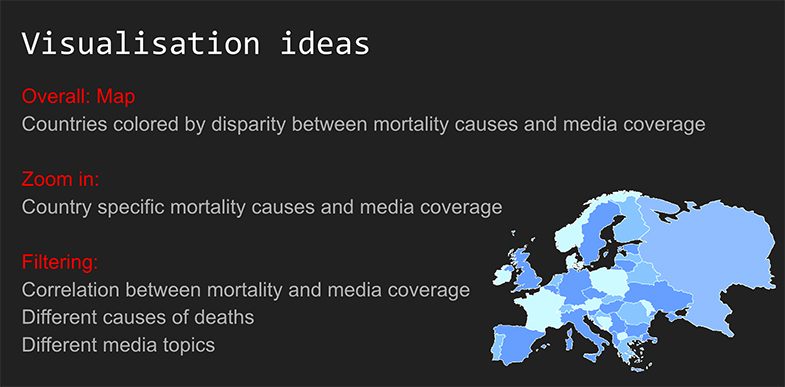
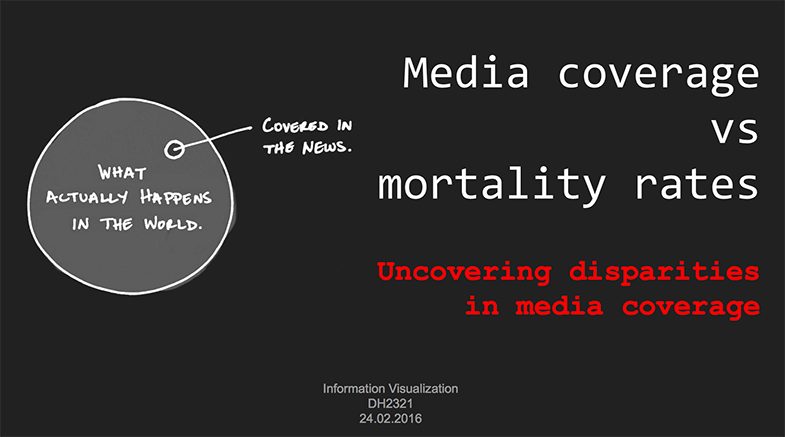
Then we did some research around our interests like what we would like to do exactly for this final project. Other meetings afterwards were more about discussing the direction and shaping up the core idea. Until the first deadline approached, we decided to work with the media coverage vs mortality rates.
Yep, we never had a complete team meeting. There was always at least one member missing.
The feedback #1 (from our supervisor)
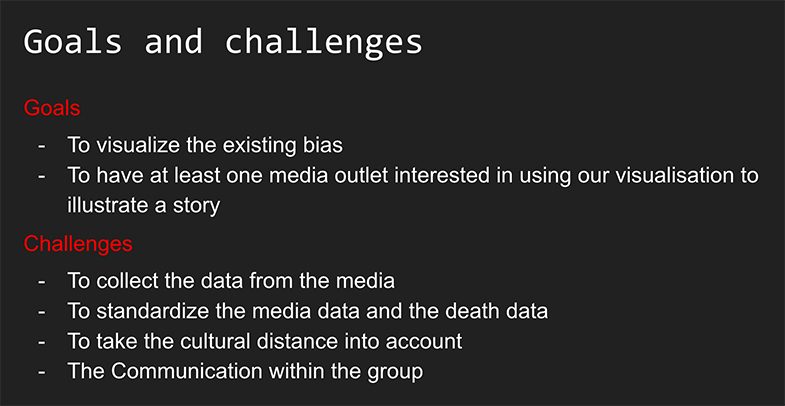
“I understand and appreciate your goal. It is one of transparency at its core. Kudos! Make it apparent in your visualization. Avoid framing your visualization with your biases. Keep it transparent. Allow the user to follow the trail of the data. That will be one of your challenges. The other challenges will be data sources and users. Where will you get your data? How will you pre process it? Also, who are your users and what are their tasks? You need to carefully think about this. I am looking forward to your path!”
“Hello World”
It seemed like our project was going well. We didn’t have many problems with our proposal even though it may sound somewhat complicated to me and I didn’t understand it thoroughly. Anyway, my role in this project during that time was a designer. I didn’t pay much attention to the discussion in the group when other members were discussing about the idea. I cared more about the execution part.
One thing that I saw was that we went all over the place most of the time. I might say that it was because we didn’t have such a team leader. Nobody made a final call. Not everyone was engaged in the decision making. It made the process slow and frustrating. I’m not sure if it was a proper way of working when we don’t settle down the direction but rather leave it open for a (better) change. Anyhow, it isn’t a good idea to have some people moving in different directions when we work as a team. It would become exhausting and difficult to manage the tasks.
Luckily, until the “hello world” demo presentation, there were some members who had more time to develop the demo. So it wasn’t so stressful for everyone. My part wasn’t that big at this point though. I could only support when it came to the design work.
We changed the concept a little bit (from “biases” to “disparities”).
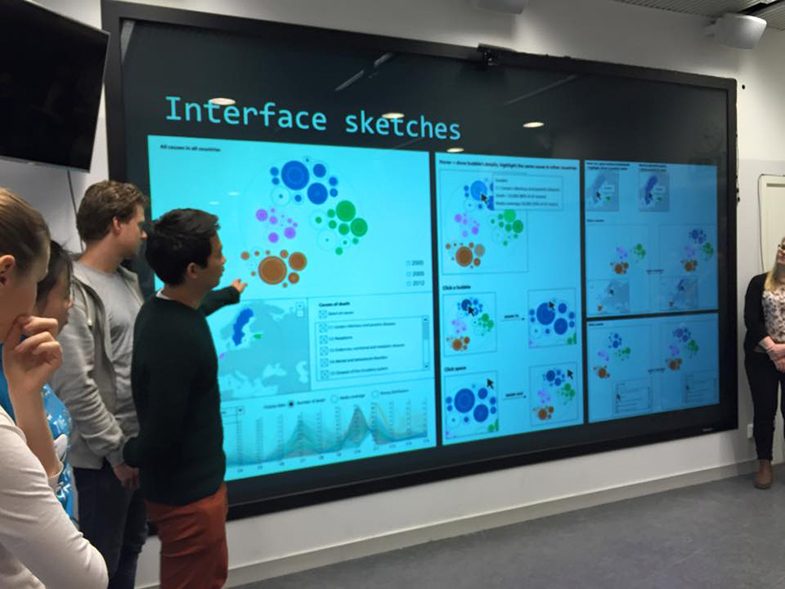
I was in charge of the interface and interaction design.
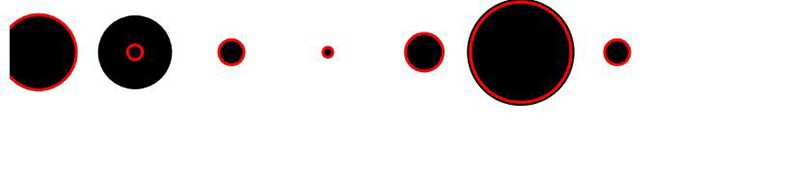
The very first demo. We used the bubbles to represent the media coverage and mortality rates. (This is the only image I found for our prototype.)
The feedback #2 (from our supervisor)
“Abstract: Your Hello World demo is on an early stage. You need more data, visual structures, and brushing among them. You need to be able to think like a data journalist, for example, looking for a story. Please, read the papers and interact with the links below.
LINKS: papers 1, papers 2, papers 3, Death Vs. You, timeline-of-violence, HIV healthdata, GDB Compare, GDB data visualizations” (I removed the links.)
Final demo
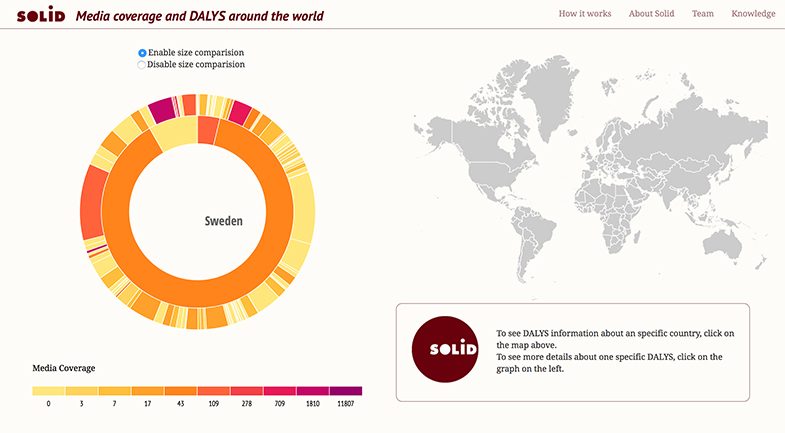
After the “hello world” demo, the group was split into smaller groups. We divided the project into smaller tasks. There were development team (worked with building the engine of the app), research team (worked with the data), and design team (me-worked with the design of the website). We used D3 to develop the main engine of the website (the visualisation or the graphs). The process wasn’t that easy and there were many problems along the way. We changed the design of the graphs a couple of times according to the data that we had. We also encountered some problems retrieving data from different sources. Some health related data set was available for some countries or some years. We searched through several resources until we decided to use DALY instead of mortality rate. The media coverage was a big thing that we discussed i.e. which media we should use and we ended up with Google.
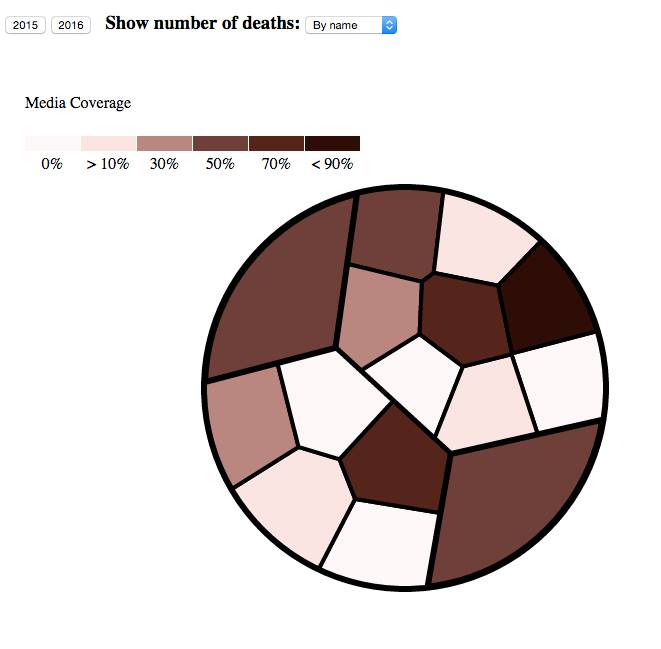
Another design of the graph that we tried. It wasn’t accurate enough so we had to drop it.
I would say that the way we worked was somewhat strange. We talked but it was quite hard to catch up with other teams. We didn’t coordinate that well I may say. When we finished some tasks, we said we finished and we kept the work somewhere. Nobody checked if that work actually worked. For example, when the research team finished with the data and stored the data in the shared drive, no one checked if the data was useable or how to use it. We didn’t communicate that well.
Then, one member of our group left Sweden. It wasn’t unexpected because she actually told some of us when we started the project. She was a project manager in the group (I named it.) and worked with the data. She was one of those who pushed the main concept of our project. Her absence wasn’t a big deal.
Nonetheless, the night before the final presentation, we tried to combine every piece together and that was when everything broke. The development team was working on the mock data for the whole time. The research team was individually collecting a lot of data and store it altogether. Not the whole team knew about all the data. When someone was absent, no one else can fill in. That was what happened. Some data was missing and some engines didn’t work out well. The app was still buggy.
It was the worst and the lowest time. The development team worked almost the whole night and slept for a few hours. There were like a few people working at that night. The rest of the team couldn’t help because it wasn’t their parts and they didn’t work with it from the beginning. Nothing worked.
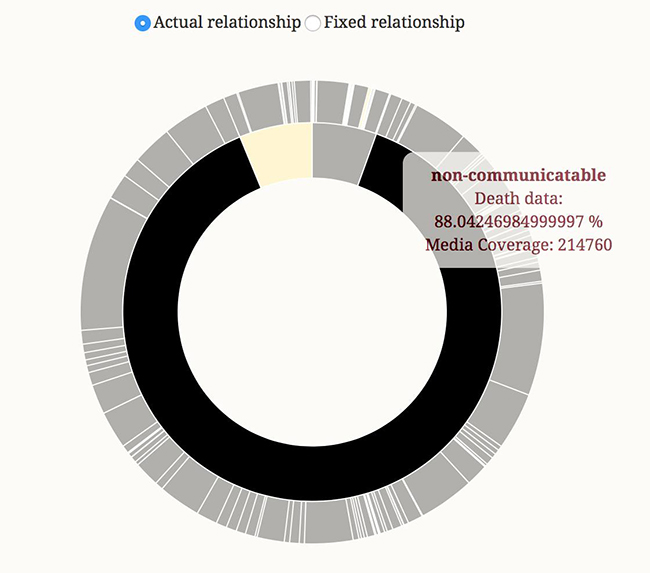
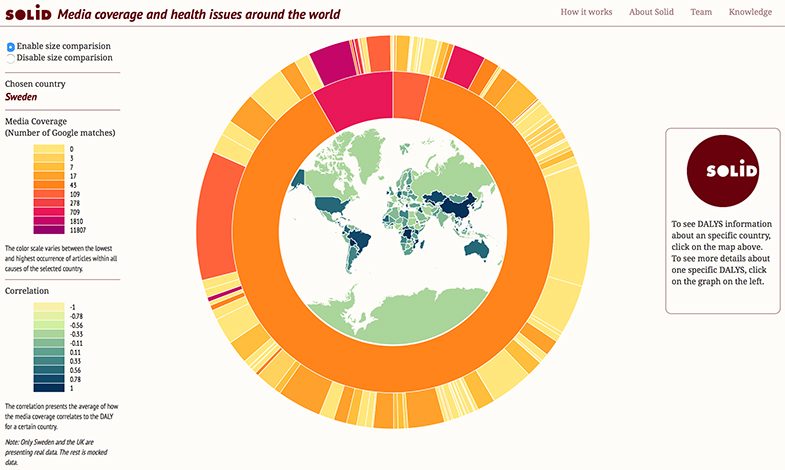
This is how the web looked like in the final presentation.
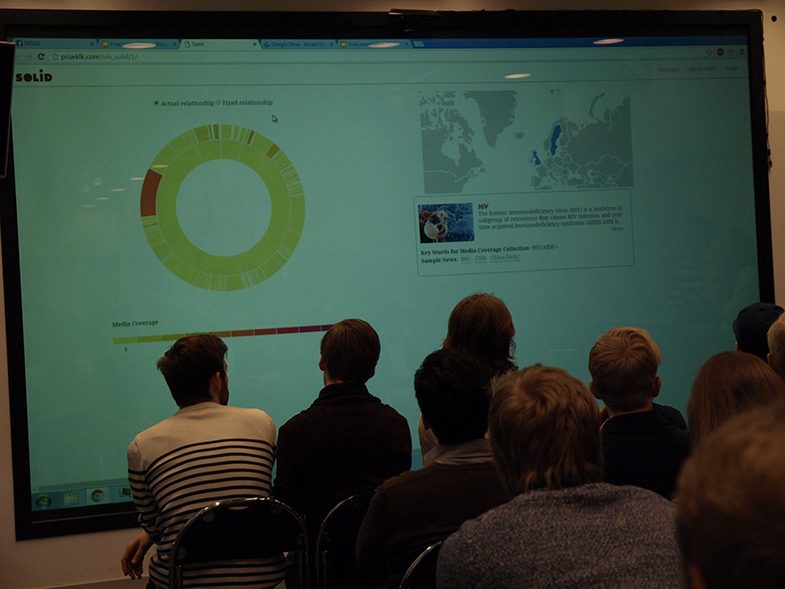
The final presentation and feedback #3 (2:56:40-3:16:20)
Big thanks to our presenters who helped our presentation otherwise everything would be even worse.
The submission
We were the only group that couldn’t finish the project in the final presentation. Everything was broken and everyone was frustrated, but we just can’t stop there. We just had to move on.
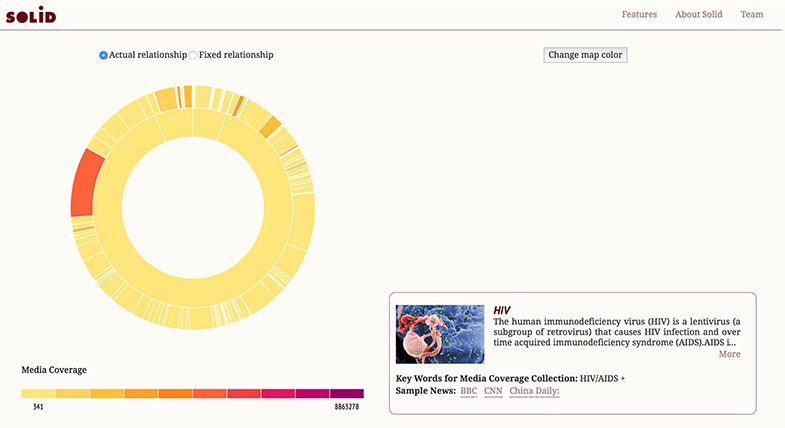
After the final presentation day, it was a weekend so half of the group left for vacation. Then, there were around 5 people who were still working actively. The other one was working in distance, and the other two were just off. We had to submit the project to the C-Awards contest. It was the last deadline of this project. I then took charge of the project manager role and assigned the tasks left in the project. It wasn’t that much actually. We already had some data. We just needed to clarify it a little bit. The app was on the way. We just needed to fix some bugs. Fortunately, we got some good feedback from our presentation. We then decided to change the design of the visualisation again. We also needed to make a video presentation to submit it to the contest.
Video by Martin Hedlund and Adrià Cruz
C-Awards
At that time, I didn’t really expect anything from this project anymore. I just wanted to finish it so I can move on. It was a very long long way and was painful to me. There were around 5-6 people left working in the team and everyone was tired.
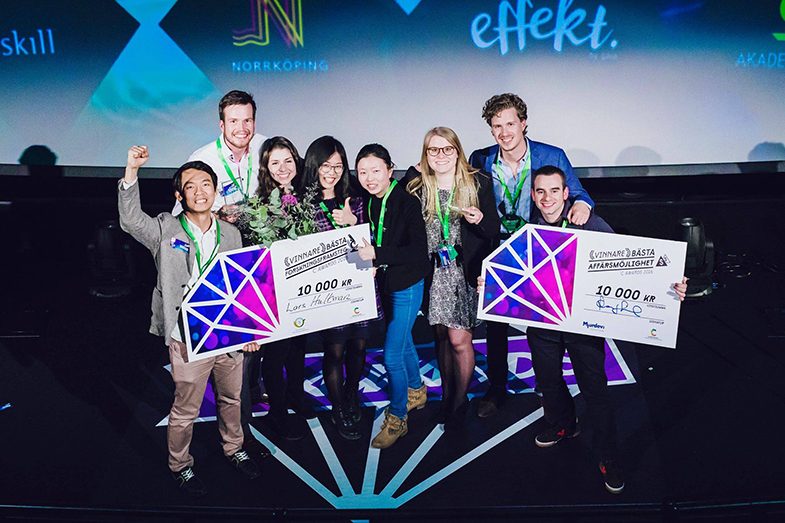
Anyway, we made it in time. The project was submitted. Somehow our project got nominated into 2 categories-Bästa affärsmöjlighet (Best Business Opportunity) and Bästa forskningsframsteg (Best Research Opportunity). The whole group gathered together again (except the only one who already left). So, we decided to go to the event. Out of the blue, we won 3 award-those 2 categories and the last one-Publikens val (People’s Choice). It was so unexpected and surprising. The journey of this project was really tough and dramatic. So much discussion and argument. Some may say hard work pays off. Yep, it really pays off.
Lesson learned
I learned a lot about web programming although I wasn’t in the development team of this project. My main role was to design the website so I had to work with the web design and inevitably web programming. I also learned to deal with the group dynamic. It seemed like 2 years at Hyper Island were not enough. Different group, different situation. One big thing that almost failed this project was the communication in the group. It would have been much easier if everyone had talked and coordinated more.
See the full project here: https://www.pruek.lk/solid
Thank you for reading :)
1 Comment
Join the discussion and tell us your opinion.
[…] Blog post by project-member Pruek […]